
July 2026 Marks Ethereum’s Critical Price Moment
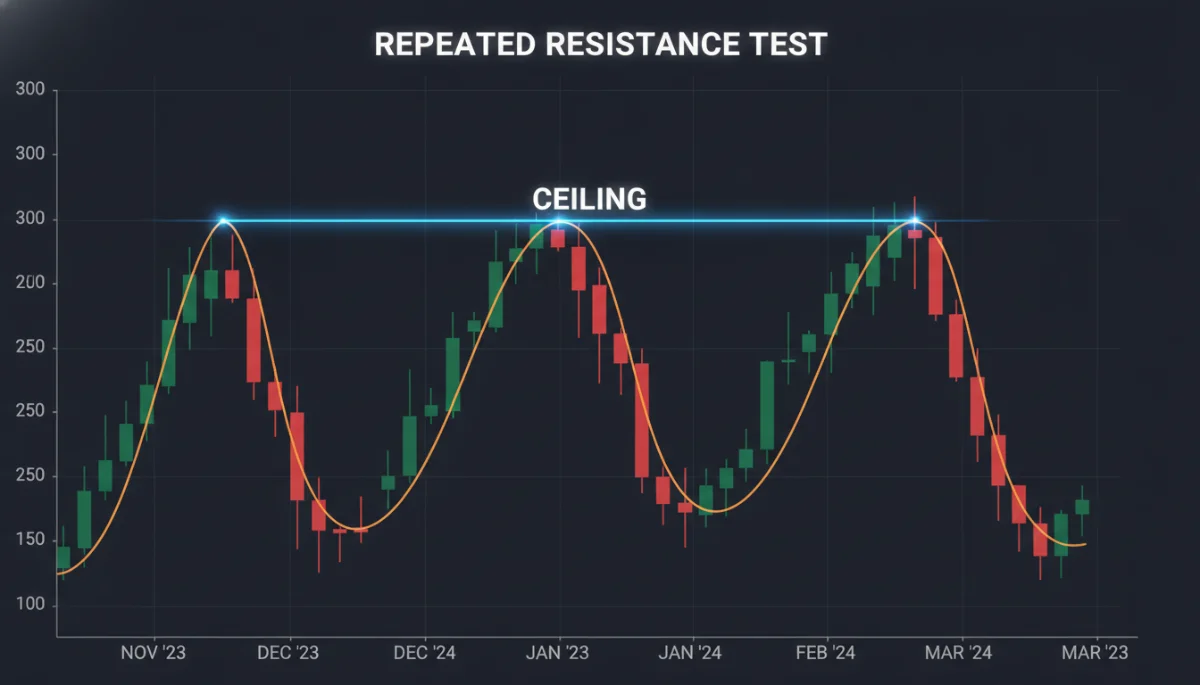
Ethereum is stuck in a high-stakes tug-of-war around the $1,800 level as July 2026 intensifies, with the asset trading near $1,779 on July 13 and that round number acting as a decisive structural barrier for the summer.
This isn’t just a psychological marker; it’s a convergence of the daily pivot point, the 50-day exponential moving average, and clustered hourly resistance levels that form a fortified price ceiling.
Why $1,800 Is a Technical Fortress
In technical analysis, certain levels act as walls rather than magnets, and the $1,799–$1,800 zone currently functions as a fortress that Ethereum cannot push through without decisive volume.
To shift from consolidation to recovery, Ethereum must deliver a sustained hourly close above $1,800, turning that former ceiling into a new floor and triggering a potential short-squeeze that could propel prices toward $1,825 and eventually test the upper Bollinger band near $1,884.
Timeframe Dissonance: Daily Hope vs. Hourly Bearishness
The market shows a clear disconnect between timeframes: daily charts hint at optimism with ETH holding above its 20-day EMA and a bullish MACD crossover, while hourly and 15-minute charts remain unambiguously bearish with sellers aggressively defending $1,800.
This “timeframe dissonance” makes trading treacherous, as buying into rallies without a confirmed breakout resembles running into a headwind—likely to be rejected by short-term sellers leaning toward oversold RSI territory.
Bitcoin’s Shadow and Macro Fear Weigh on Altcoins
Ethereum cannot move independently while Bitcoin dominance hovers around 56%, a high that funnels capital toward the perceived safety of market leaders in a risk-off environment.
With geopolitical tensions and macroeconomic uncertainty—including interest rate shifts—driving the Fear & Greed Index down to 28 (in “Fear”), investors prioritize liquidity and exits over altcoin value, leaving Ethereum to compete for redirected volume.
On-Chain Activity Signals Repositioning, Not Bull Run
A sharp 49% surge in Uniswap V3 fees and a similar explosion in Curve DEX volume over the past 24 hours suggest active repositioning rather than new buyer inflows.
During downturns, rising fees typically indicate investors moving tokens to cold storage, rebalancing portfolios, or hedging against further downside—signs that the market is twitchy and bracing for volatility instead of launching a bull run.
Two Clear Paths: Breakout or Structural Vacuum
- Bullish Breakout: A sustained hourly close above $1,800 would flip the technical landscape, likely force a short-squeeze, and open the path to $1,825 and potentially $1,884.
- Bearish Slide: If $1,800 holds and support at $1,753 breaks, momentum evaporates, entering a structural vacuum with minimal historical buying interest that could trigger rapid price declines.
Strategy: Patience Over Panic Trading
The clearest lesson for traders is to not fight the range—flipping coins between $1,753 and $1,800 is a high-risk, low-reward game with little edge until a confirmed breakout occurs.
Waiting for a decisive close above $1,800 on the hourly chart, or a clean breakdown below $1,753, provides the only reliable signals to act without gambling on range-bound noise.